We’ll be at HIMSS Chicago April 18-20 🚀 Visit us at booth 7521!
- Solutions

FreeAgent CRM solutions to empower your business.

B2B Sales & Marketing
Lift your business up out of spreadsheets and email.

B2B Customer Service
Maximize your team’s efficiency and enhance customer satisfaction.

CRM for Clinics
Boost attendance rates, and maximize your referral network.

CRM for Healthcare
Connect your systems and teams in one holistic workplace.

CRM for MedTech
Accelerate operational efficiency and surface new opportunities.

CRM for Manufacturers
Connect your people, data, and processes for better outcomes.

In-House Services
Delivering lasting value from start-up to success.
- Product

Powerful, easy to use CRM your whole team will love.

Email
Supercharge your company’s most high-leverage channel for selling. Phone
Dial up the wins. Boost sales efficiency and elevate your company’s phone presence. SMS
Enjoy 95% open-rates when you add text messages to your sales toolset. Meetings
Schedule meetings faster and manage them easier. Tasks
FreeAgent helps your team stay on task. Reporting
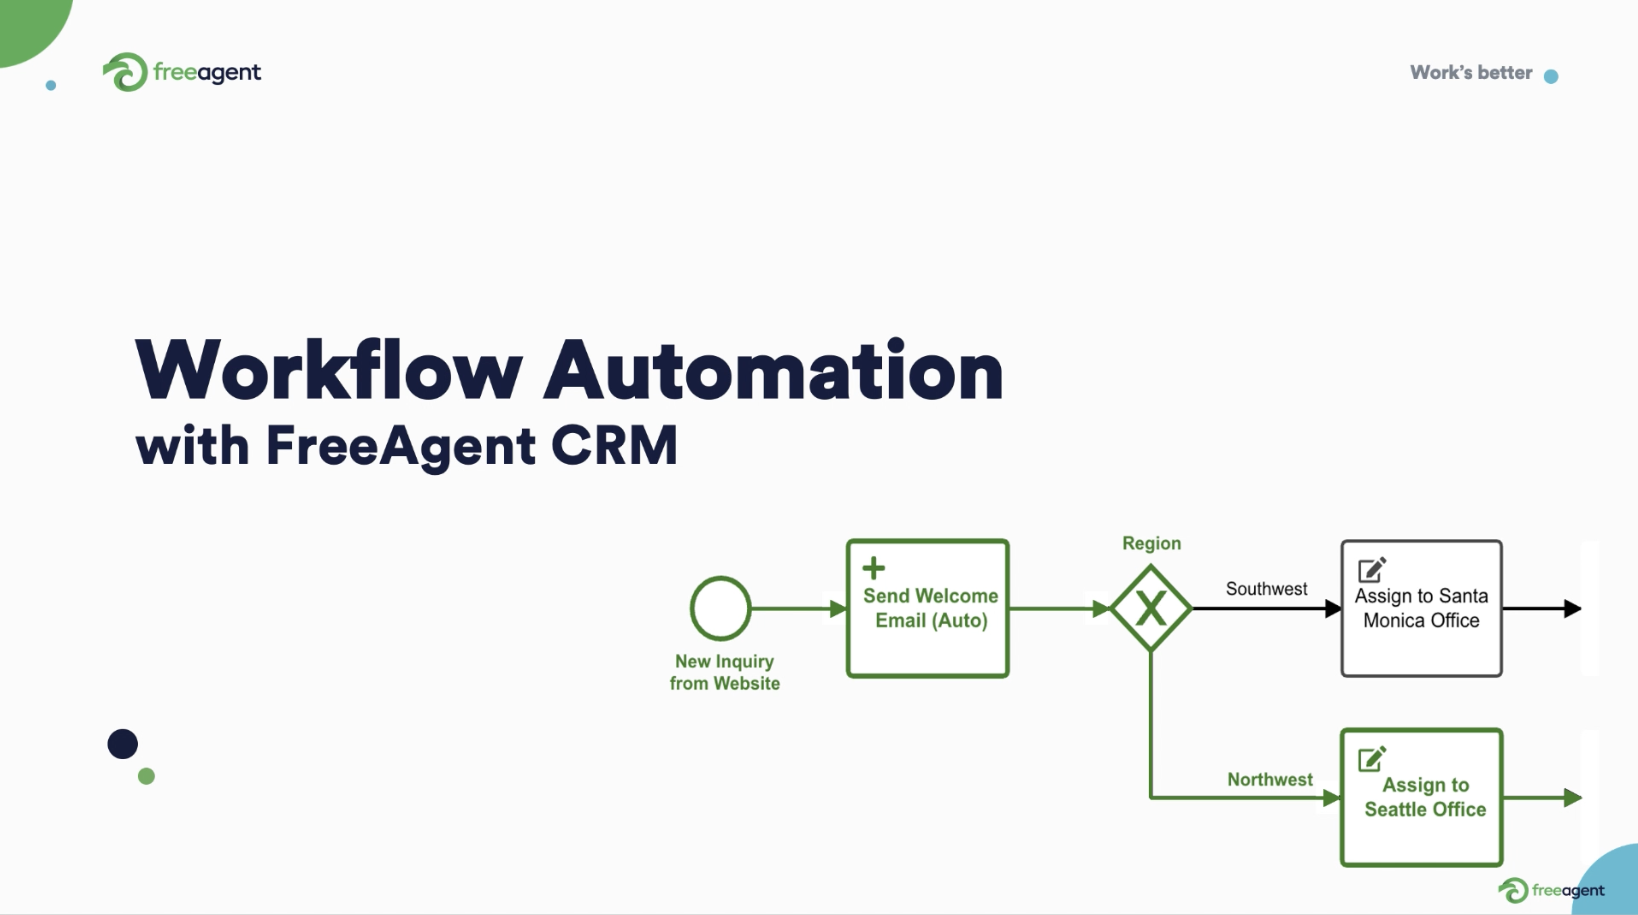
Finally, reporting you can rely on. Automation
Spend less time on admin and have workdays full of impact. AI Assistant
Uplift your work with generative AI-powered features.

Webforms
Deploy webforms and capture data in your CRM instantly.

Integrations
Seamlessly connect FreeAgent CRM to all your favorite tools. - Pricing
- Resources
- Company
Discover the FreeAgent difference
FreeAgent is trusted by the world’s most productive teams
We design software that transforms the way teams collaborate, grow revenue and communicate with customers.


Best CRM for
Reporting
Real-time reporting at your fingertips, without the scramble
Save hours you used to spend preparing reports
Easily customize reports for your needs

POPULAR FEATURES
Performance Tracking
Clickable charts
List View Inline Edit
Sales activity leaderboards
Schedule reports
Email / Call Analytics


See the full picture
Truly connected data
Know what's really going on
Make better decisions

TASK LIST & NOTIFICATIONS
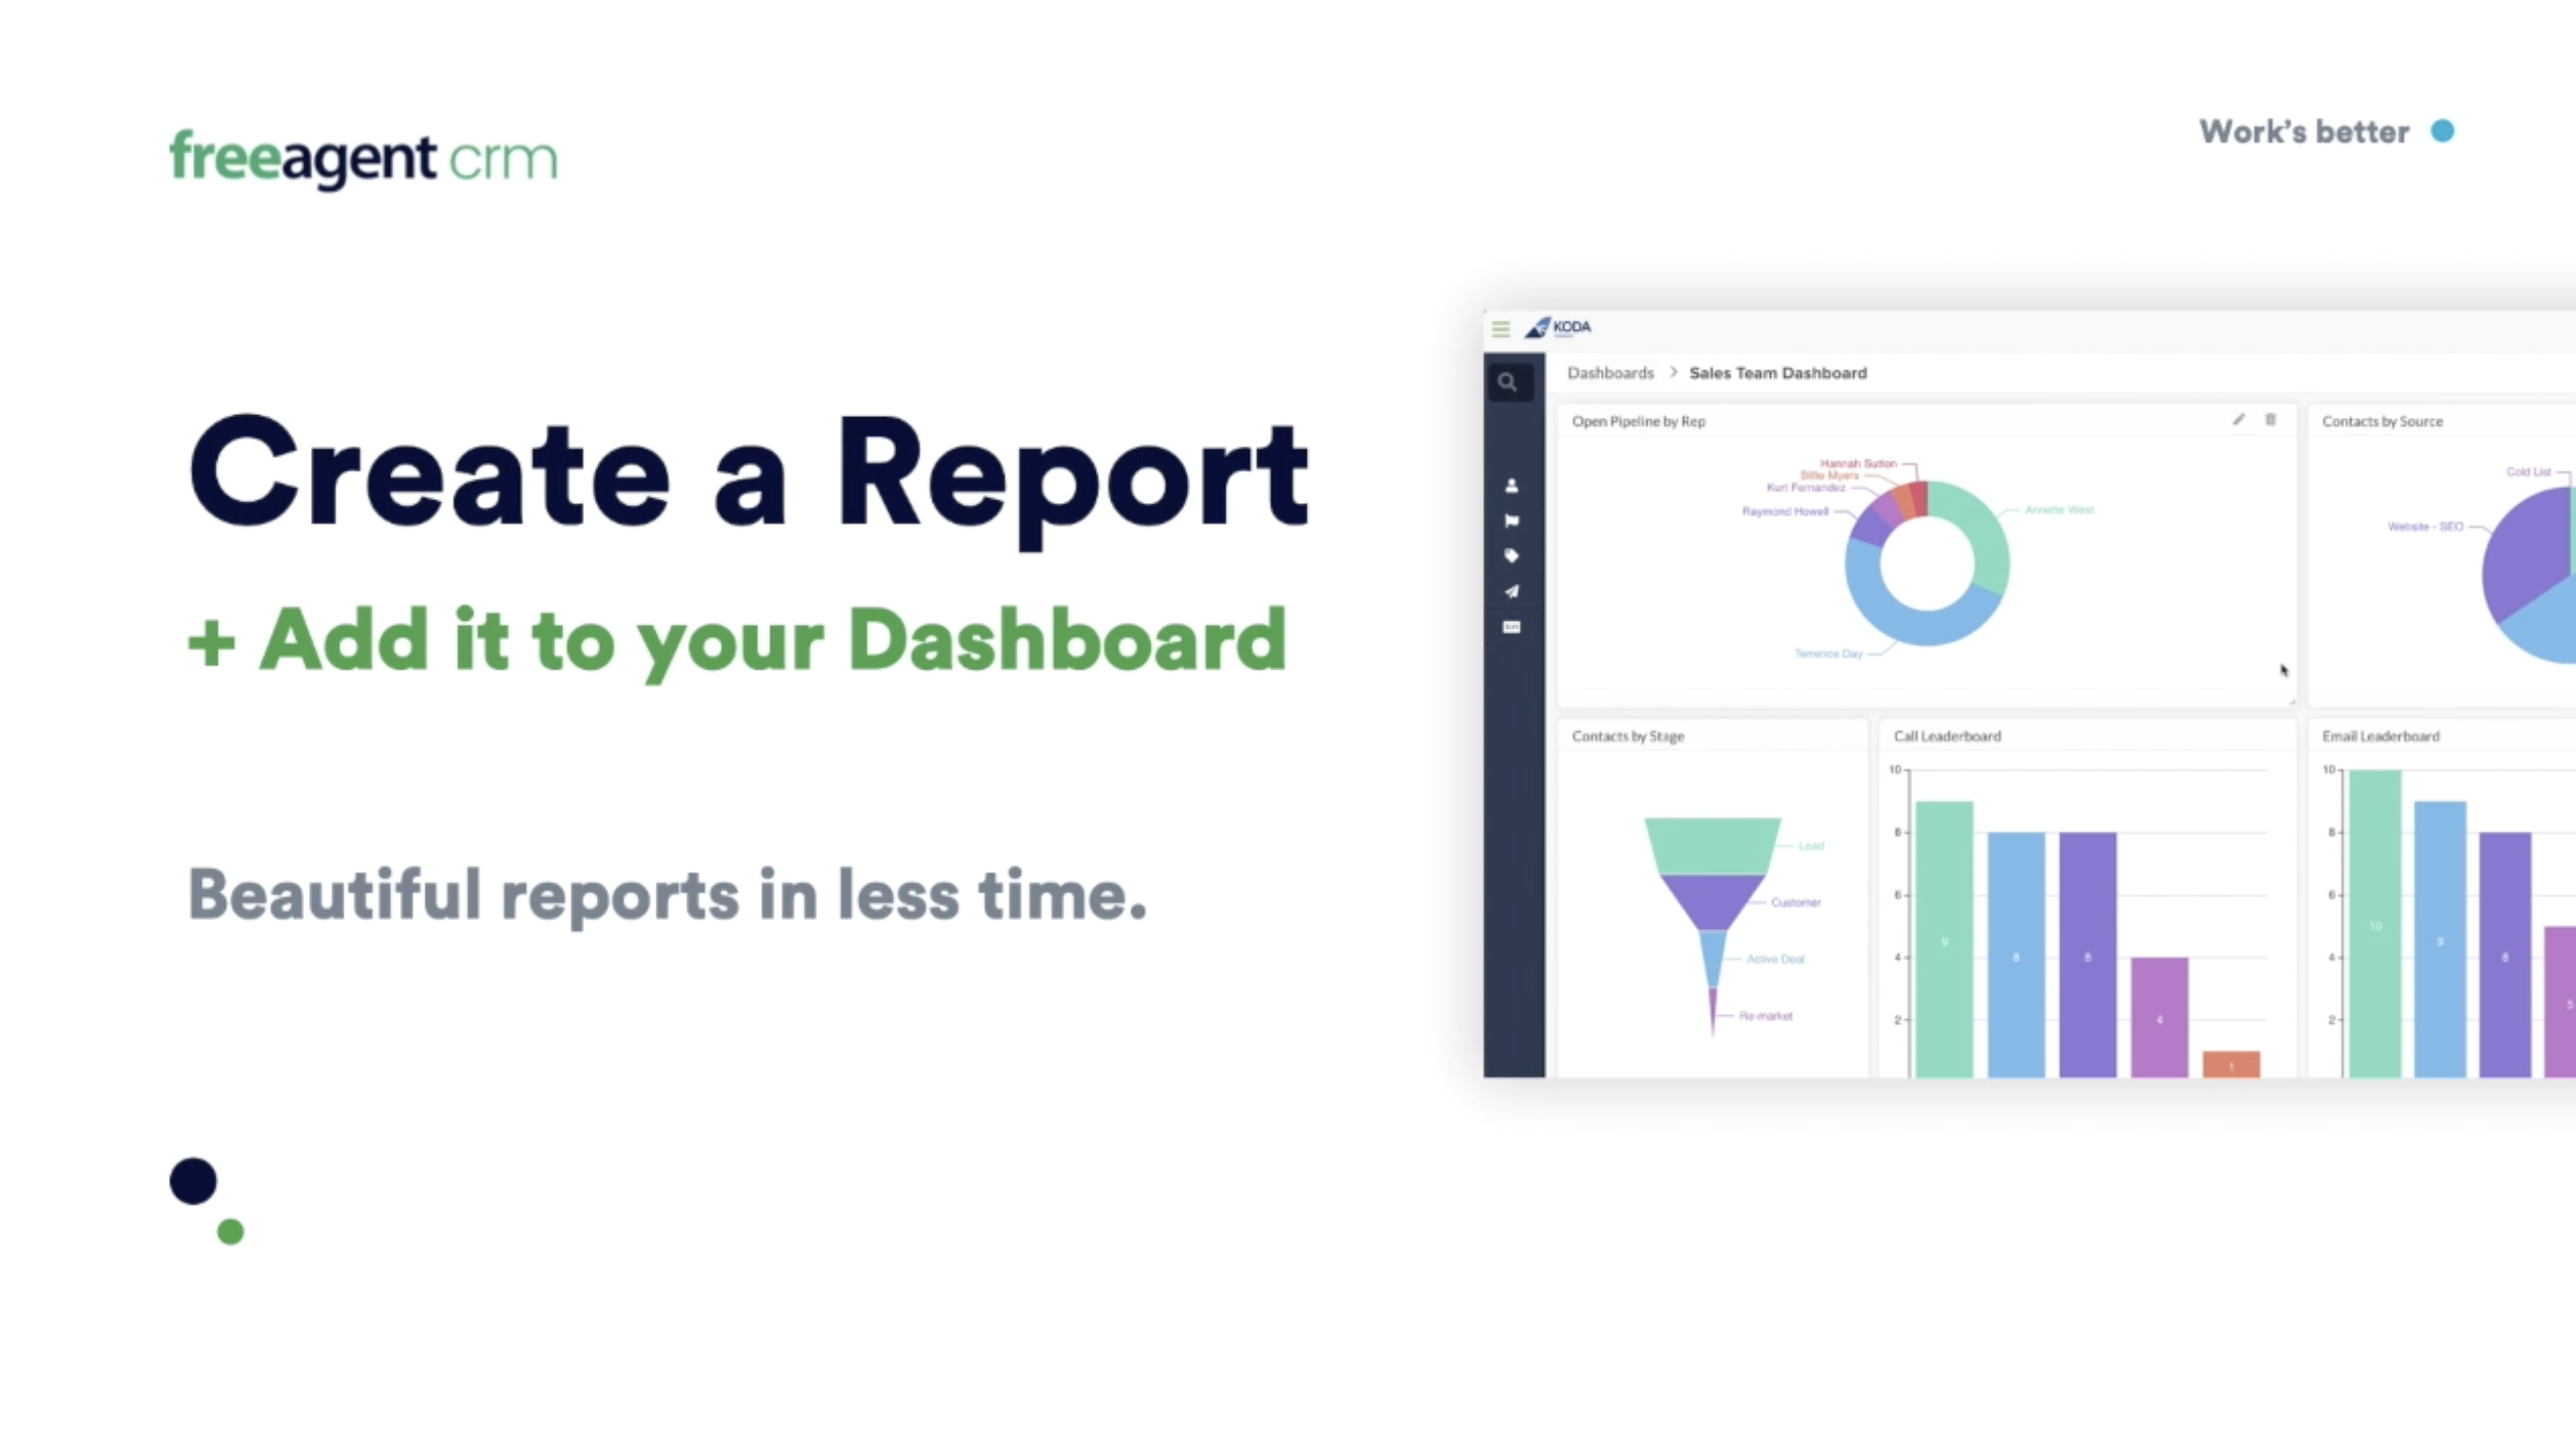
Real-Time Dashboards
Create and customize dashboards with a collection of charts to track essential metrics across all CRM areas.
Gain valuable insights with the flexibility to add as many charts as needed.
Create and customize dashboards with a collection of charts to track essential metrics across all CRM areas.
Gain valuable insights with the flexibility to add as many charts as needed.

Views
Transform any record collection into visually stunning reports.
Easily switch between visualization options such as List, Board, Rolodex, or Calendar views.
Tailor your List Views to display the exact data you want with limitless column combinations, pinning, and filter/search capabilities.
With List View inline edit, you can edit CRM data as quickly as a spreadsheet. Double-click any field value to quickly enter and save a change to the data.
The kanban-style Board View showcases just what's important. Customize card information. Include pictures too. Pivot boards by any dimension.
Customize, save, share, or keep Views private.
Easily rename Views, favorite them, and even add Views to the company menu with 1-click.
Add mini-dashboards (dashlets) above any View for quick insights.


REMOTE WORK VISIBILITY FOR MANAGERS
Performance Tracking
Track pipeline and revenue achievements by sales rep, team, marketing channel, industry, or any other dimension
Compare performance to goals, across a team, or by time period, such as week over week, or by this time last quarter
Sales Activity Reporting:
Compare email/phone/task activity by rep, day, and even time of day
Compare activity volume/type to revenue achievements to find correlation
Provide better coaching with call talk-ratio and meeting outcome analytics
Track cycle times of deals and projects
Use time-in-stage reporting to see where deals and projects are getting stuck
Provide individual rep dashboards to track activity, performance, and easily identify areas of activity

Pipeline Reporting
Track pipeline and revenue achievements by sales rep, team, marketing channel, industry, or any other dimension
Stage change history: track every change in your pipeline and view linked deal activity
Stage Probability-Weighted Forecasting
Funnel reports; track conversion rates by stage
Track pipeline and revenue achievements by sales rep, team, marketing channel, industry, or any other dimension
Stage change history: track every change in your pipeline and view linked deal activity
Stage Probability-Weighted Forecasting
Funnel reports; track conversion rates by stage

REMOTE WORK VISIBILITY FOR MANAGERS
In-depth analytics for email, calls, and tasks
Measure Email Campaign Effectiveness, Email Template Effectiveness, Delivery Tracking, Open and Click Tracking, Email Activity Level reporting, and more
Measure Call Outcome Reporting, All Dials by Time and Duration, Searchable Call Transcription, Talk Ratio Reporting, and more
Measure activity levels across your team (across all channels) to pinpoint improvement opportunities and uncover all-stars who are powering your organization's success.

Easily share and collaborate reports
Share real-time reports or dashboards effortlessly with direct URL links.
Collaborate with your team by making dashboards and views public, allowing for editing and perfecting together.
Advanced security rules ensure data and access control at the record and field levels.
Share real-time reports or dashboards effortlessly with direct URL links.
Collaborate with your team by making dashboards and views public, allowing for editing and perfecting together.
Advanced security rules ensure data and access control at the record and field levels.

REMOTE WORK VISIBILITY FOR MANAGERS
Powerful charting and visualization
Enjoy a wide range of chart types, including pie charts, gauges, xy scatter plots, column charts, funnels, waterfalls, and bubble charts.
Set targets and compare data against goals or historical achievements.
Customize colors and icons for consistent visual representation across all charts.
Enjoy a wide range of chart types, including pie charts, gauges, xy scatter plots, column charts, funnels, waterfalls, and bubble charts.
Set targets and compare data against goals or historical achievements.
Customize colors and icons for consistent visual representation across all charts.
Built-in templates for dashboards and charts
Lead Management

Account Management

Opportunity Management

Quote Management

Project Management

Customer Service Management


TASK LIST & NOTIFICATIONS
Advanced reporting capabilities
Utilize time-based reporting with auto-grouping and trend analysis by day, week, month, or year.
Click into any chart element to drill down into the data and associated records.
Leverage dot-walking to combine data from multiple Apps to gain unique insight.
Utilize time-based reporting with auto-grouping and trend analysis by day, week, month, or year.
Click into any chart element to drill down into the data and associated records.
Leverage dot-walking to combine data from multiple Apps to gain unique insight.

Data export, integration, and automation
Export list reports to CSV for further analysis or integration with other systems.
Schedule PDF or CSV report generation on a daily, weekly, or monthly basis and automate email distribution.
Set exception alerts to stay on top of critical follow-up actions.
Export list reports to CSV for further analysis or integration with other systems.
Schedule PDF or CSV report generation on a daily, weekly, or monthly basis and automate email distribution.
Set exception alerts to stay on top of critical follow-up actions.
FreeAgent CRM reporting at a glance
|
FEATURES |
|
|
Real-Time Dashboards |
Create and use dashboards which include a collection of charts to track your most important metrics and gain insight. Place as many charts on a dashboard as you need. |
|
Views |
Display any collection of records as a 'view' and turn it into a beautiful report, choosing whether to visualize as a List, a Board, in Rolodex form, or on a Calendar. Customize it, save it, share it, or keep it private. Even add a mini-dashboard (dashlet) on top of any view. |
|
Easily Share any View or Dashboard |
Share any Real-time Report or Dashboard via a direct URL link. Cut, paste, click, view. Simple. |
|
Collaborate on Views and Dashboards |
Work on perfecting your Dashboards and Views together by making Dashboards and Views public and allowing edit access to your team. |
|
Secure Dashboards, Views, and Data with Advanced Security Rules |
You're in control of who sees what when, across any Dashboard or View. Secure data at the record or field level, too. |
|
21 Different Chart Types |
Whether it's a simple pie chart or a gauge or number, or more sophisticated xy scatter plots, grouped column charts, funnels, waterfalls, or even bubble charts, you'll have the visualizations you need to monitor your business effectively. |
|
Set Targets |
Set multiple targets on any chart to view data in context against goals or historical achievement. |
|
Customize Colors and Icons |
Set custom colors for data values that remain consistent across all charts - for example "green" for SQL, "orange" for MQL, "purple" for re-market, and so on. Set custom icons too to make your List views visually engaging. |
|
Customizable Templates |
Pre-built Dashboards and Views for Contacts, Accounts, Deals, Tickets, and more - that you can customize and save for future use, saving you time and ensuring consistency in reporting. |
|
Time-Based Reporting |
Auto-group and trend data by day, week, month, or year. View dates in your preferred format, and add 'time ago' dates to make data come alive. For example: Last Interaction: 3 hours ago. Do this for any date field you want. |
|
Clickable Charts |
Click into any slice or bar in a chart to drill into that data set and see more. |
|
The Best List View of any CRM |
Configure list views to show just the data you want to see, just the way you want to see it. Select any combination of columns with no limitations. Pin columns to freeze them when you scroll, set column widths just right for every column. Search within a specific column. |
|
List View Inline Edit |
Edit CRM data as quickly as a spreadsheet. In List View, you can double-click any field value to quickly enter and save a change to the data. |
|
Best in Class Board Views |
Customize 'cards' to showcase just what's important for your Apps - Contacts, Accounts, Deals, Tickets, and more. Include pictures too. Then create visual stunning board view reports that can pivot your data by any dimension - Leads by Lead Source, Accounts by Creation Month, Deals by Close Week or by Rep or by Stage. |
|
Dot.Walking |
Easily build reports using data from multiple Apps to gain next level understanding. For example: which contact lead sources have the highest win rate in deals? Which high priority tickets are from my highest value customers? |
|
Group By Two Dimensions |
Group by one or two dimensions, and choose whether to Pareto results |
|
Pivot Tables |
Output reports with group by's either as a List or in Pivot Table form for a quicker understanding of trends |
|
Easy Filters, Sort, and Search |
Find the records you need in seconds - add as many filter conditions, sorts and searches you need. Save your reporting criteria in a single click. |
|
Dynamic Calculated Fields |
Add dynamic calculations to report on connected data sets - like Last Interaction on a Contact, Account, or Deal, or # of Touches, # of Emails, # of Quotes, First Interaction, and more. |
|
Header Calculations on Reports |
Calculate count, average, max, min, and sum for currency and number fields in column headers within list and board views. |
|
Use Glances to Create Tabs on List Reports |
Glance by various dimensions to slice your list reports into pieces. It's a more visual way to group your report data. |
|
Add Custom Visualizations |
Have a special need? Extend the reporting framework with your own IT resources to plug-in any visualization you want |
|
Print any Report |
Print any report - Dashboard or View - to a PDF so you can save it away or email it to colleagues |
|
Data Export and Integration |
Easily export any List report to CSV for further analysis or integration with other systems |
|
Schedule any Report |
Schedule report generation - run daily, weekly, or monthly reports automatically. Even auto-email reports to a list of recipients you specify. Output scheduled reports as PDF or CSV |
|
Exception Alerts |
Manage by exception by receiving alerts and escalating action when followup falls through the cracks |
|
Audit Logs |
See every single change to Leads, Accounts, Opportunities and more, who made the change, and exactly when |
|
Multiple Pipelines |
Report on and progress work across multiple pipelines for your different lines of business. |
|
Forecasting |
View sales forecasts on a gross or weighted basis with custom, calculated weighting formulas. |
|
Cycle Time Analytics |
Breakdown total cycle times to stage-based cycle times across any stage-based workflow and pivot groupings by any stage, choice list, date or reference field. |
|
Task Reporting |
Track important, task-based metrics across your team such as cycle times analytics, tasks by owner, by project and more. Customize a task dashboard with various KPIs and metrics using FreeAgent's widgets to keep a pulse on your team's work. |
|
Activity Logs |
See every digital interaction your team makes all in one easy to understand, searchable timeline |
Lead the way to a better workday
Connect with our CRM experts to unleash your team’s potential.